Warning: "continue" targeting switch is equivalent to "break". Did you mean to use "continue 2"? in /homepages/46/d242325231/htdocs/DGIviscom/wp-content/plugins/revslider/includes/operations.class.php on line 2734

Warning: "continue" targeting switch is equivalent to "break". Did you mean to use "continue 2"? in /homepages/46/d242325231/htdocs/DGIviscom/wp-content/plugins/revslider/includes/operations.class.php on line 2738

Warning: "continue" targeting switch is equivalent to "break". Did you mean to use "continue 2"? in /homepages/46/d242325231/htdocs/DGIviscom/wp-content/plugins/revslider/includes/output.class.php on line 3679
InfoGraphics – Designosaur Graphics Inc. Visual Communications
All dinosaur toys featured on this page are copyrighted properties of their respective owners.
InfoGraphics2021-03-07T00:10:49+00:00

Need to communicate a message or information
effectively to a wider range of audience?

Infographics gets the word across – big or small, young or old, green or purple, nothing beats infographics to get the job done. Complex data and enormous size information can be cognitively processed quickly with the help of correct and efficient graphic visualization that enhances the human visual system’s ability to recognize patterns and trends.

It requires special skills and talent to effectively create one. A mere data visualization of a chart or graph is not enough. Infographics pushes the envelope of data visualization – it requires professional analysis and creative conceptualization to effectively communicate the message and retain it to the viewer.  In most instances, it also helps send a “call to action” idea that most consumer brands seeks.

DGI VisCom can help you create that effective infographic you require. Check out some of our designs below and get in touch with us to start a project.
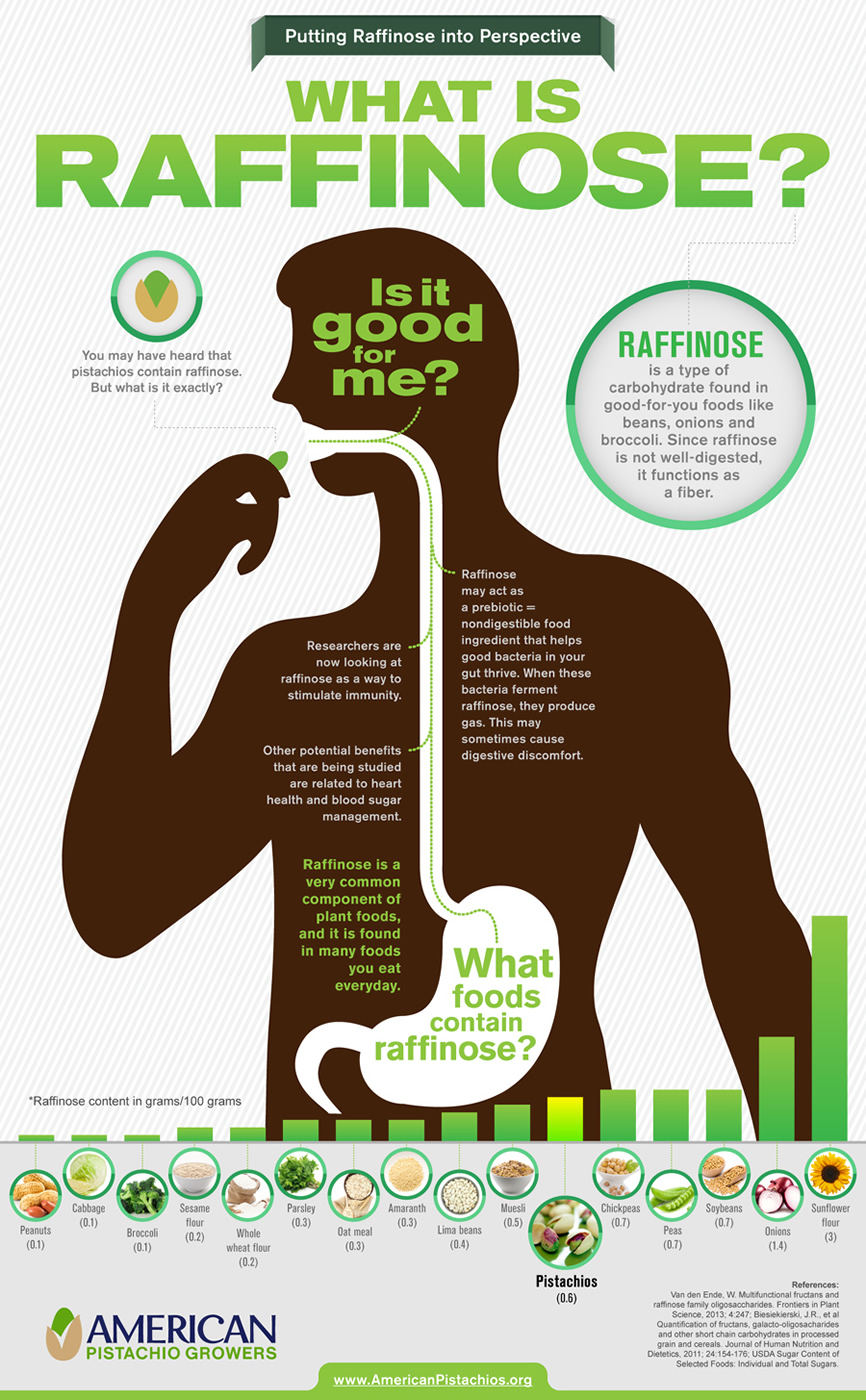
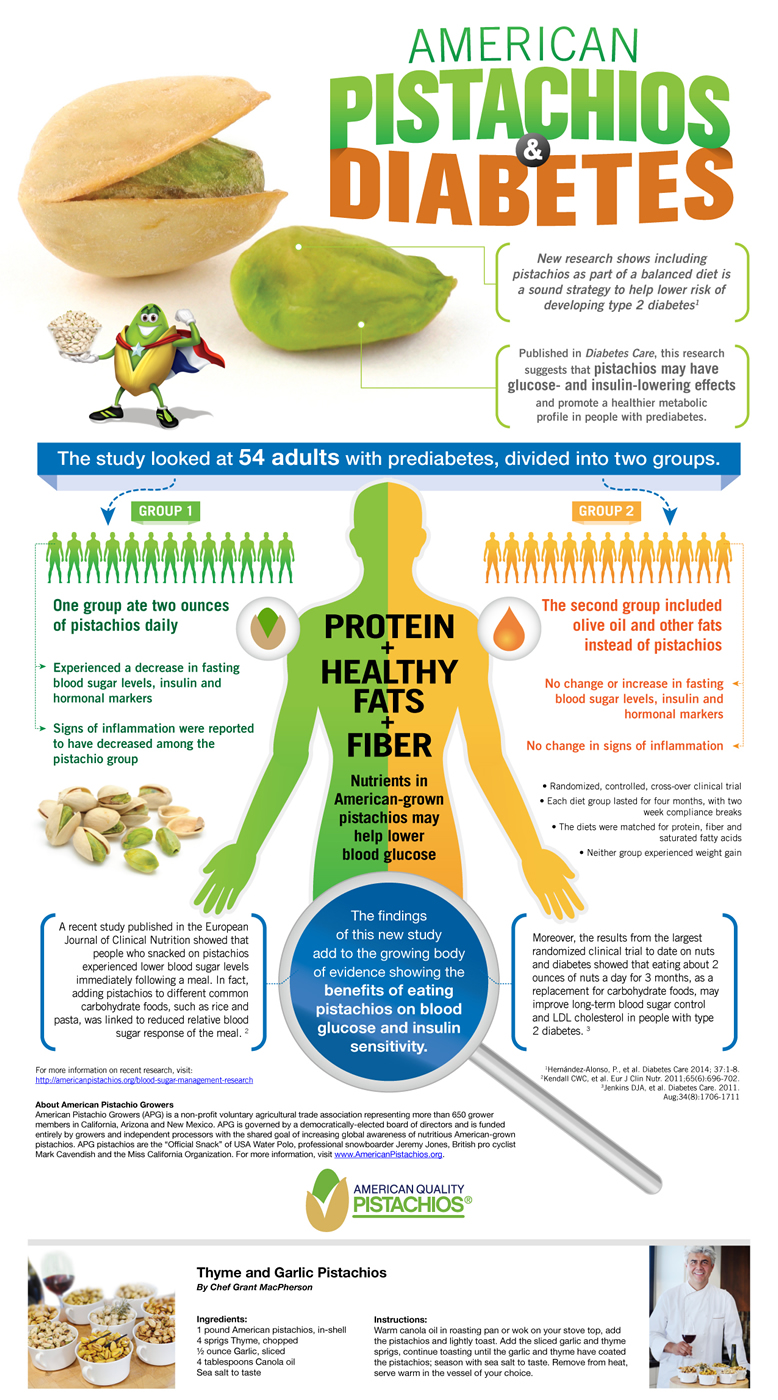
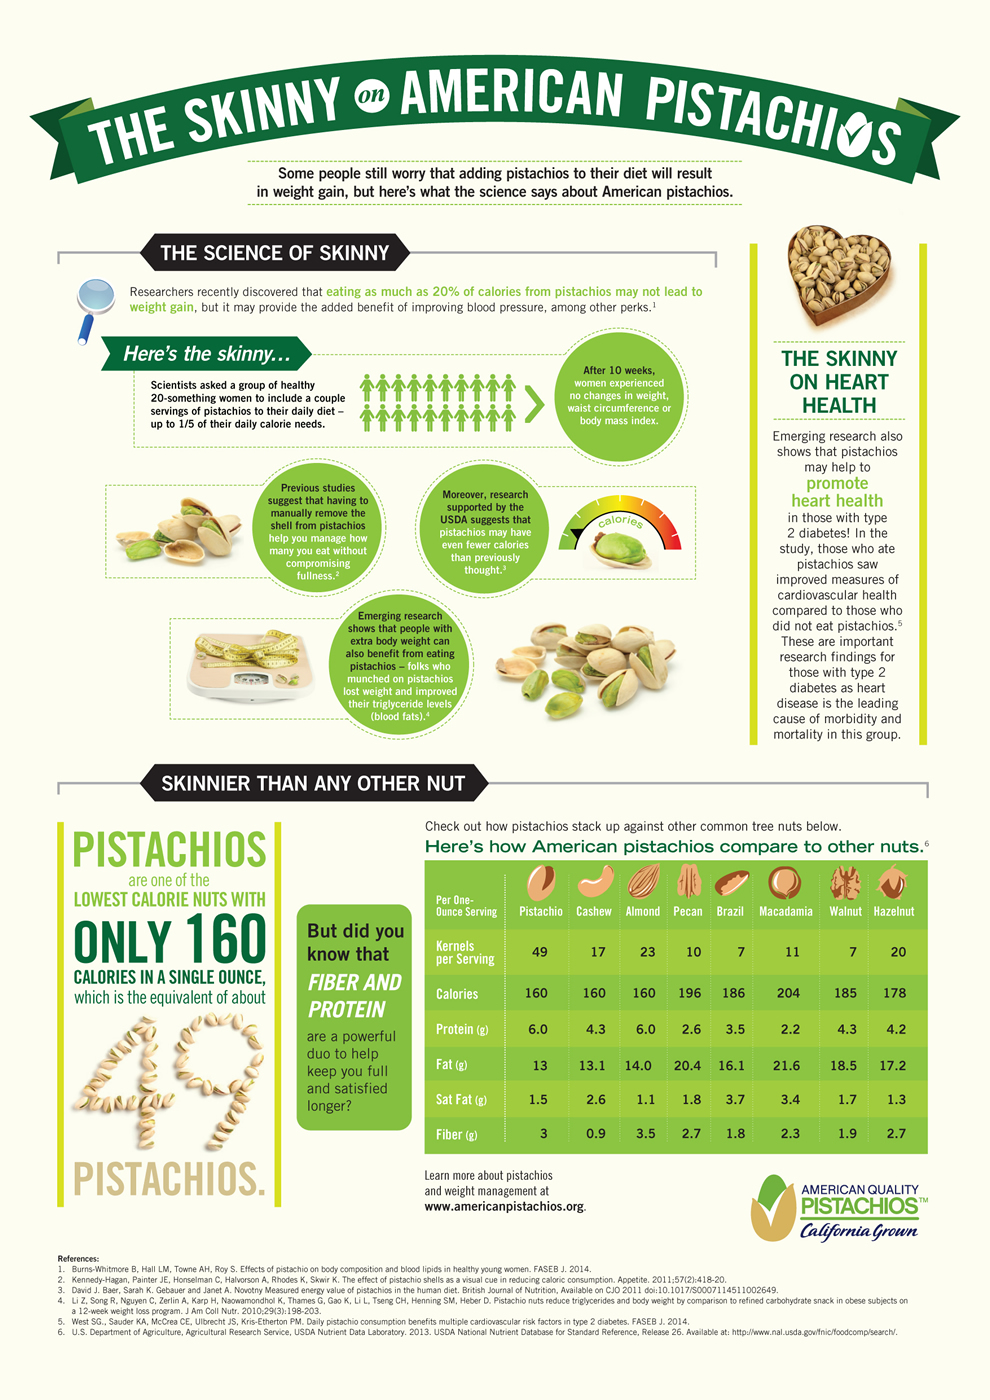
Infographic:

An infographic (information graphic) is a representation of information in a graphic format designed to make the data easily understandable at a glance. People use infographics to quickly communicate a message, to simplify the presentation of large amounts of data, to see data patterns and relationships, and to monitor changes in variables over time.

~www.whatis.techtarget.com

American Pistachios Sports Nutrition Infographic
American Pistachios Diabetes Infographic


The Skinny on American Pistachios Infographic
The Love Nut Infographic
More Reasons to Eat Pistachios Infographic
CLOSE
CLOSE